ERS investment return data as reported by Political newsletter Quorum Report
The adopted changes will reduce investments in fixed income securities and domestic stocks and redirect these reductions to alternative investments, i.e., real estate, hedge funds. This reallocation intends to improve the rate of return (ROR) on the ERS portfolio.
According to the Pew Trusts, http://www.pewtrusts.org/en/projects/public-sector-retirementsystems, the ranking of ERS is not world-class, in fact, it is not even TRS-class. As the table below shows between 2005 and 2015, the performance of ERS relative to other public retirement systems has deteriorated. In other words, the ERS ranking has gotten worse over time.
Table 1: Rates of Return S&P 500, ERS, TRS, and U.S. Pension Funds, 2005-15Duration | S&P 500 Return | ERS Return | TRS Return | Median U.S. Return | ERS Rank |
1-year | 1.4% | 0.5% | 4.2% | 3.4% | 65/73 |
5-year | 12.5% | 9.1% | 10.9% | 10.9% | 62/73 |
10-year | 7.2% | 6.2% | 6.8% | 6.7% | 53/73 |
Source: Damodaran online, http://www.stern.nyu.edu/~adamodar/New_Home_Page/data.html and Pew Trusts, http://www.pewtrusts.org/~/media/Assets/2017/04/Pew-Pension-Investment-Data.xlsx
The cash inflow to ERS consists of contributions from the state and state employees and the proceeds from fund investments in financial assets. These proceeds are the appreciation/depreciation of financial assets and the interest and dividends from these financial assets.
Between 2009 and 2016 active members increased from 141,223 to 146,390, an increase of 3.7 percent. Payroll increased from $5.6 billion to $6.7 billion, a 20.3 percent increase. Retirees increased from 75,722 in 2009 to 103,758 in 2016, a 37.0 percent increased. This increase is ten times greater than the increase in employment. Given the contribution rates are near their maximum, a substantial increase in state and employee contributions are not very likely. One needs to assume that this motivated the ERS Board to pursue riskier investments to improve the fund's ROR.
While member and employer contributions have not been sufficient to cover retirement benefits over the last ten years, investment income has provided sufficient cash flow to cover retirement benefits for four years, 2007, 2011, 2013, and 2014. Investment income in 2015 and 2016 was not sufficient to cover retirement benefit outlays.
One reason may be the shift of ERS financial assets into alternative investments beginning in 2012, increasing from 9.3 percent of investments in 2012 to 25.1 percent in 2016. This 15.8 percentage point increase in alternative investments was accomplished by reducing both fixed income and equities by eight percentage points each.
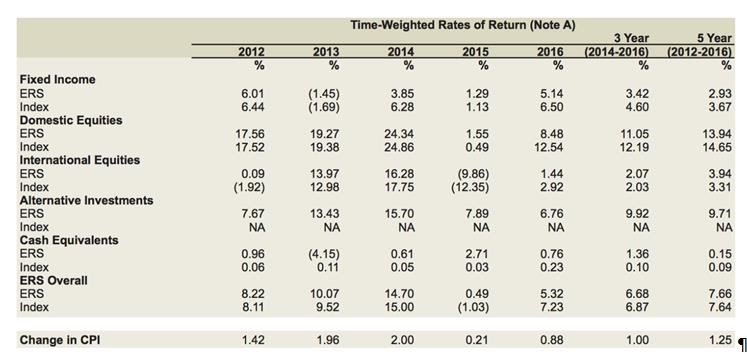
Table 2 from ERS’s annual report shows the 5-year return on alternative investments (9.71 percent) was greater than the 2.93 percent return on fixed income securities. But the 13.94 return on domestic equities exceeded the return from alternative securities. What’s interesting is that the ERS return on fixed income instruments and domestic equities was less than the market index return.
Table 2: Time-Weighted Rates of Return and Asset Allocations, 2012-2016
Source: ERS, FY16 Comprehensive Annual Financial Report, p. 95
The ERS reports that its overall 5-year return (7.66 percent) exceeded the overall Index return (7.64 percent), it does not appear that the overall index includes a return from an alternative investment index. In fact over the last five years, among financial assets, domestic equities have the highest rate of return13.94 percent. Unfortunately, the ERS rate of return was less than the S&P index used to evaluate a pension fund’s performance. Had ERS invested in a market index fund its total return would have been 3.6 percent greater over the five-year period.
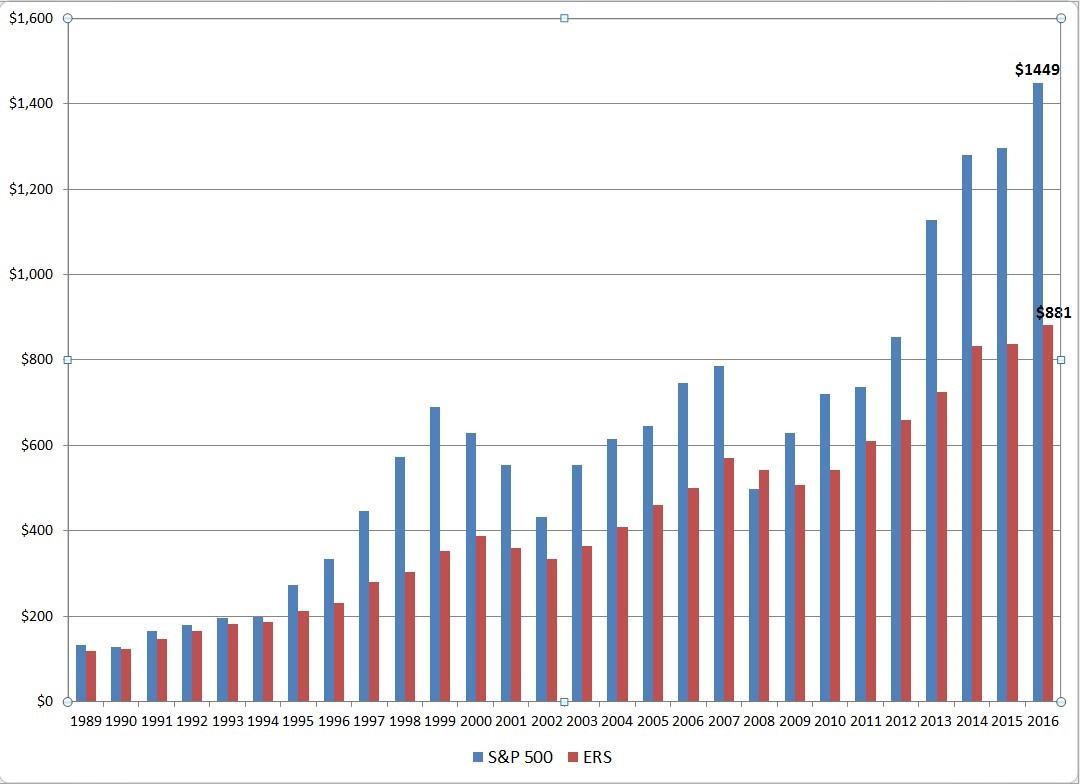
Chart 1 shows the ERS fund’s gross rate of return on the trust fund from 1989 through 2016. I compared these annual rates of return to the gross returns from investing in the S&P500. The chart shows the S&P 500 had a greater return in 15 of the 27 years that ERS rates of return data were available. Some might conclude that in having a greater rate of return in 12 of the 27 years is like the UT “victory” over USC, 24-27.
Chart 1: Gross Rates of Return, S&P 500 and ERS, 1989-2016
Source: ERS, Open records request, August 2017 and Damodaran online, http://www.stern.nyu.edu/~adamodar/New_Home_Page/data.html
Had ERS invested in the S&P 500 beginning in 1989, the value of this asset class would be 64.5 percent greater in 2016. Not only would the overall return been greater, but the risk would have been lower. A higher return at a lower risk is a reasonable investment strategy to follow.
Using the Stern School of Business file on financial asset returns, http://people.stern.nyu.edu/adamodar/New_Home_Page/data.html I found that for every 30 year period following the creation of ERS in 1947, the compound average annual rate of return exceeded the eight percent return that ERS had previously used as its desired return that would ensure trust fund health.
As everyone who has taken a principles of finance course knows, the likelihood of outperforming the market approaches the next positive number after zero. In fact, Warren Buffett will be receiving a million dollar check from a bet he made a decade ago that the return from investing in the S&P 500 would exceed the returns from investing in hedge funds.
Before your next board meeting, I hope you, the folks elected and picked to protect the retirees, will consider this: reallocate the financial assets of ERS and reduce alternative investments and invest in the index used to evaluate your investment performance. You know that ERS has spent over $260 million over the past three years for alternative investment management fees. These fees were about one percent of the total management fees spent by public pension funds. For this expenditure, according to your annual report, you received a 9.71 percent for alternative investments, a rate below the S&P 500 market rate of return14.65. Spend more; earn less, a truly outstanding investment philosophy.
Finally, before the 86th Regular Session, I suggest you create a study group to lay out what would be required to merge with the Teacher Retirement System (TRS). Had you followed the TRS investment choices, its rate of return would have been at least 0.6 percent higher over the past ten years. I assume it would not be too difficult to determine where the fund would be today had it received a 0.6 percent increase in the rate of return for ten years. My best guess is that this slight increase in returns would have increased dollar returns by $100 million per one billion dollars invested over ten years.
ERS will probably have a million and one reasons why my analysis is full of it. My response would be to look at the returns of the S&P 500 versus the fund’s rate of return. Had you invested in the market would the fund's assets be greater today? The answer is a definitive YES. In fact, since the start of ERS in 1947, in every subsequent 30 year period, the average annual rate of return exceeded the minimum eight percent return required to stay at their 30year unfunded liability objective. Finally, would payments to alternative investment management advisors be eliminated? Again, YES. A hundred million dollars here, a hundred million dollars there and soon one is talking real money.
So, members of the ERS Board of Directors, I hope you’ll reconsider how to invest the funds contributed to ERS to increase the fund’s rate of return and reduce expenses. Raising returns and reducing costs seems to be a worthwhile objective to achieve.
Dr. Greenfield holds a Ph.D. in economics from the University of Texas. He worked for three
Comptrollers of Public Accounts, and since retiring from the state in 2000, Greenfield teaches economics at ACC and UMUC.
Postscript: According to the QR’s “Agencies doled out $10.6 million in bonus pay to investment officers last year,” ERS awarded total bonuses of $2.7 million to 69 employees. According to the State Auditor’s report, these bonuses were based on:
- Exceeding the target benchmark by 0.0005 percent (.05 basis points) for the fiveyear period FY11-FY16. (.05 basis points is probably one-twentieth of the one basis point you receive on your checking account balance.)
- Was less than the target benchmark by 0.18 percent (18 basis points) for the three-year period from FY13-FY16
- Was less than the target benchmark by 1.81 percent (181 basis points) for the one-year period from FY15-FY16.
Interesting incentive system, one’s performance over time deteriorates, i.e., the ROR falls further under the benchmark, yet one gets a bonus. If I were compensated at the Comptroller’s
Office in a similar fashion, I would now be a zillionaire. J